Sports Tourism Accounts for 10% of Global Travel Market
A new report released in April this year by the World Economic Forum and consulting firm Kearney highlights that sports tourism has become one of the fastest-growing segments of the global travel economy, with its market size projected to surpass $1.7 trillion by 2032. According to data from UN Tourism, sports tourism currently accounts for 10% of global tourism expenditure.
Earlier, online travel company Expedia Group conducted a consumer survey on sports tourism, commissioning consultancy Censuswide to survey 2,000 consumers across eight countries—Australia, Canada, France, Germany, Japan, Mexico, the United Kingdom, and the United States—who had traveled to watch a sporting event in the past 12 months. The survey covered details such as spending, trip planning, event type, travel purpose, and travel companions.
In terms of spending, the survey found that the average total expenditure per sports tourism trip was $1,580 (approximately 11,000 RMB).
Spending mainly consists of four components:
- Accommodation ($480, approximately 3,300 RMB);
- Airfare per person ($420, approximately 2,900 RMB);
- Additional activities ($370, approximately 2,600 RMB);
- Event tickets ($310, approximately 2,100 RMB).

Regarding trip duration:
- 62% of respondents said their most recent sports trip lasted 2 to 6 days;
- 17% took a week or longer for their most recent sports trip.
In terms of number of events:
- 51% of respondents attended a single match on their most recent trip;
- 37% attended multi-day events lasting 2 to 4 days.
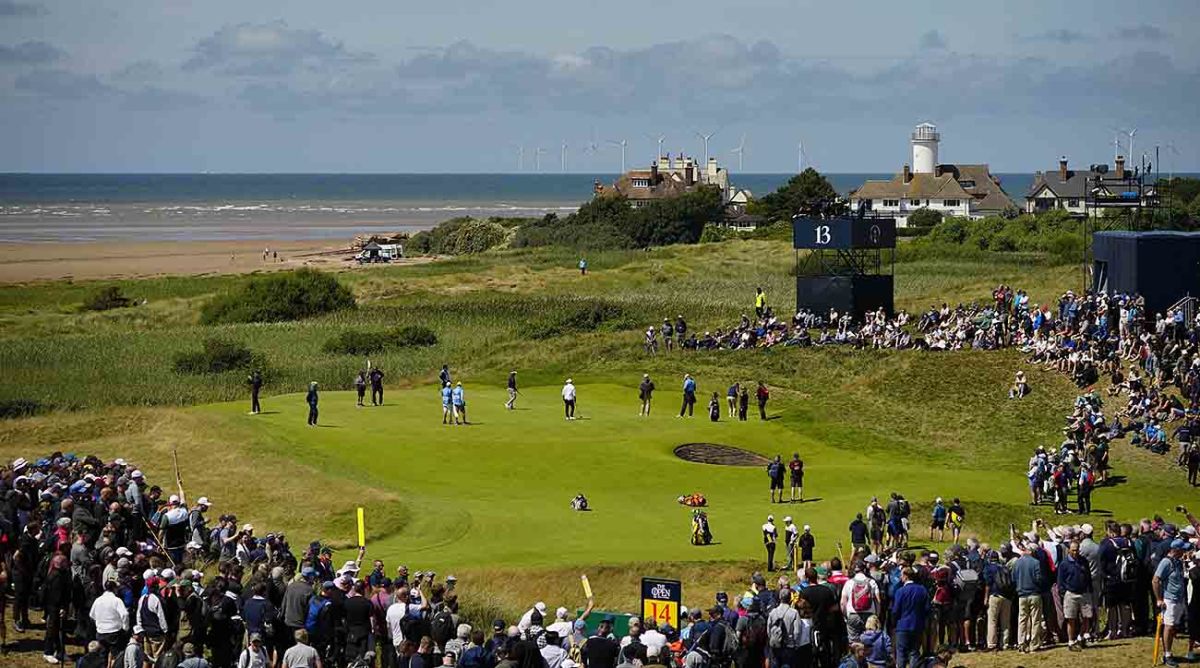
Sports fans are highly enthusiastic about attending events in person:
- 44% of respondents said they traveled abroad to watch a sporting event on their most recent trip.
- This proportion is even higher among younger generations—56% of travelers aged 16-34 said they traveled abroad to watch an event.
By country, the tendency to travel abroad for events:
- Canada had the highest share of respondents traveling abroad, at 62%, followed by Germany (58%) and France (57%).
Regarding travel companions:
- Friends (35% of respondents), partners (34%), and family (33%) were top choices, highlighting the social nature of sports tourism and its role in strengthening emotional bonds.
Priorities when planning a sports trip:
- 69% of respondents prioritized watching the event;
- 47% felt spending time with family and friends was more important;
- 45% prioritized experiencing the destination's culture;
- 26% chose to follow a specific athlete;
- 26% prioritized enjoying the atmosphere at bars/restaurants.
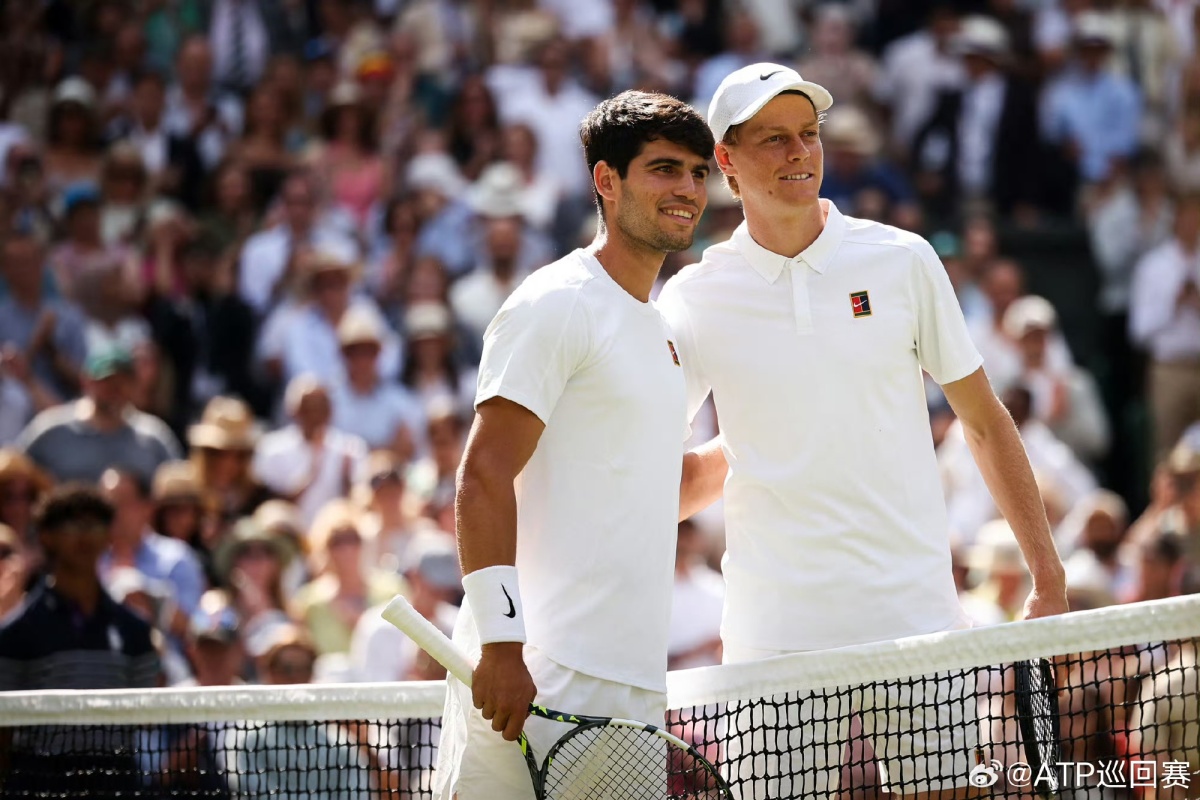
Above: 2025 Wimbledon final, Alcaraz vs. Sinner
Priorities varied slightly by country:
- U.S. respondents prioritized spending time with family (58%);
- Japanese respondents were more keen on following specific athletes (46%);
- Mexican respondents focused more on experiencing the destination (60%).
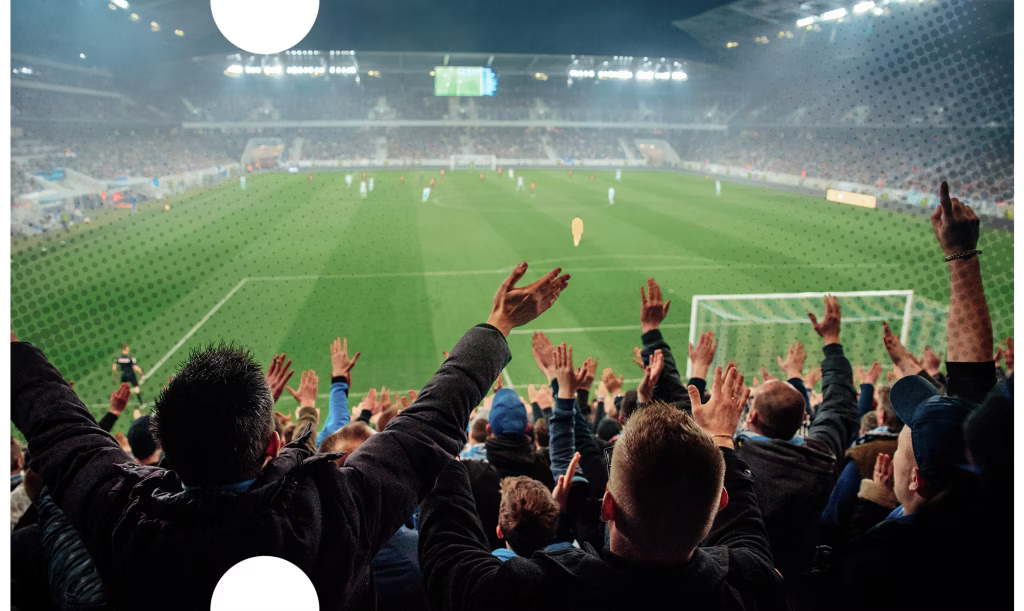
Which sports events are most popular among travelers? In order of respondent share:
- Football (36%);
- Baseball (7%);
- Basketball (6%);
- American football (6%);
- Ice hockey (6%);
- Tennis (5%);
- Golf (5%);
- Motorsports (3%);
- International events (3%);
- Marathon/triathlon (3%).
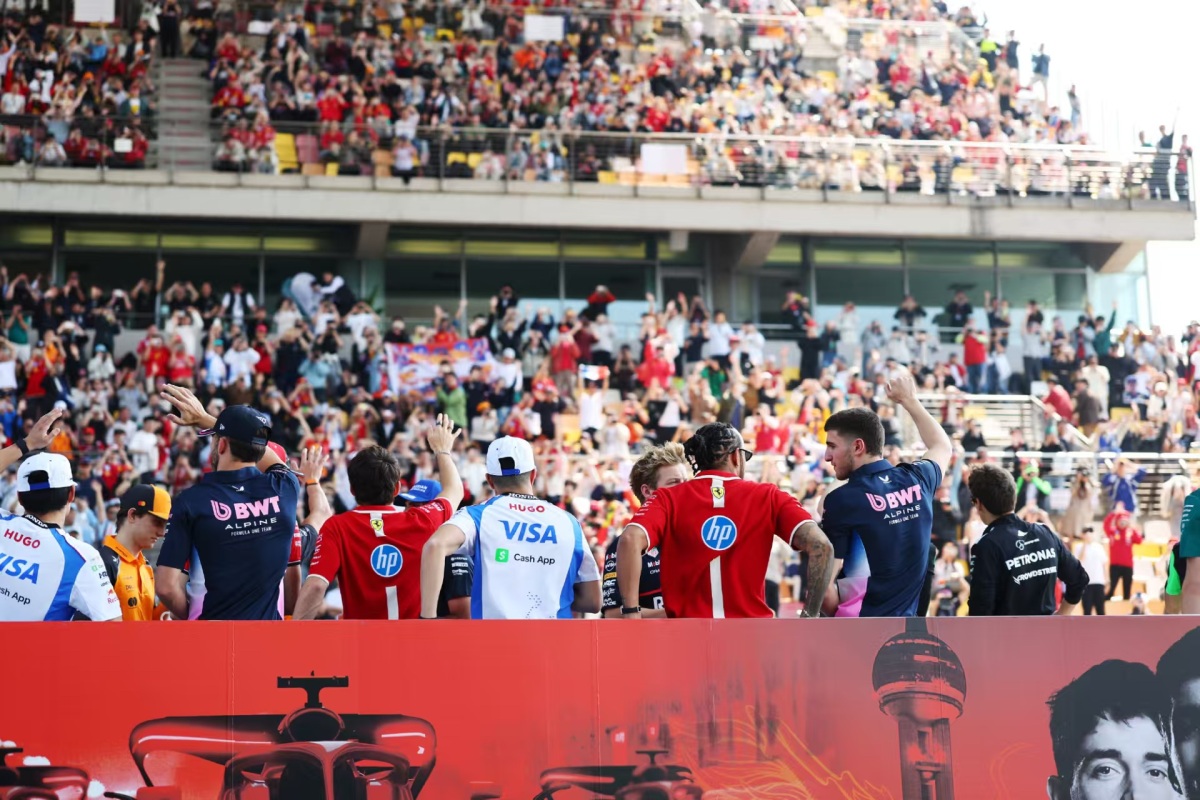
Above: 2025 F1 China Grand Prix
Favorite sports events varied by country:
- Respondents from the UK, Germany, and Mexico favored football the most, at 64%, 54%, and 53% respectively;
- U.S. travelers preferred American football, with 24% of respondents;
- Canadian travelers favored ice hockey, with 37% of respondents;
- Japanese travelers preferred baseball, with 26% of respondents.
By age:
- Across all age groups, 71% preferred watching men's sports events, 20% preferred events involving both men and women, and 9% preferred women's sports events.
- Younger generations were more inclined to watch women's events or mixed-gender events; among travelers aged 16-34, nearly a quarter had attended mixed-gender events, and 12% had attended women's sports events.

Above: Gauff wins the 2025 French Open
Regarding accommodation, while over half of travelers stayed in the host city, nearly half chose to stay in other cities, including:
- Nearly a third chose a more well-known location near the event;
- 20% chose a destination more than an hour's drive from the event;
- 20% chose a less popular destination near the event.
Travelers also visited other cities, with 81% having visited other destinations, including:
- 45% explored the surrounding area
- 30% traveled to other parts of the country
- 21% traveled to other countries
Younger travelers were especially likely to go elsewhere, with 88% of those aged 16-34 exploring destinations beyond the host city.

Beyond watching sports, other preferred activities included:
- Dining (57%);
- Shopping (52%);
- Sightseeing (45%);
- Relaxation (33%);
- History/culture (25%);
- Adventure (22%);
- Nightlife (21%).
By country:
- Japanese travelers were more inclined toward sightseeing/visiting tourist attractions (60%);
- German travelers were more inclined toward historical/cultural activities (33%).
By age, those aged 25-34 were more likely to prefer:
- Relaxation/wellness activities (42%);
- Adventure/outdoor activities (35%);
- Historical/cultural activities (32%).

Looking ahead, enthusiasm for sports tourism remains high:
- 84% of respondents plan to watch a sporting event in the next 12 months, with 58% planning to watch two or more events.
- Respondents planning to watch a sporting event in the next 12 months expect to spend an average of over $1,200 (approximately 8,400 RMB).
| Source: Original report
| Image credit: Original report, official social media of relevant events
| Editor: Esther